To start, I formulated a question and answer dialogue:
I have been tempted in the past to ‘call out’ reluctant students, but Alfie Kohn’s article, ‘Your Hand’s Not Raised? Too Bad: I’m Calling on You Anyway, provides needed perspective into this issue. When done improperly or insensitively, calling on these students might do more harm than good.
Being fairly introverted myself, I sympathize with many people’s preference to remain in the shadows of a crowd, but nine year old introverts, preferences aside, need to practice public speaking in a safe environment.
Being introverted doesn’t make you averse to collaboration. Everyone should practice social skills. https://t.co/P87RzlBL68— Bart Miller (@BarMill) February 1, 2016
Articles like Chapter 1. Why Talk Is Important in Classrooms from Content-Area Conversations by Douglas Fisher, Nancy Frey and Carol Rothenberg, and Talking to Learn by Elizabeth City reinforce the position that Listening and Speaking form the foundation of Reading and Writing.
Gathering data
My methodology for gathering data is simple. At various times in class, I propose an open ended question. For example, I might ask for interpretations of an idiom, impressions of an image, or opinions about a famous quote. That there are no correct or incorrect answers is made clear to students, as is the fact that ‘I don’t know’ is an acceptable response. Students may also ‘pass’. Sometimes the provocations are directly connected to our unit of inquiry, sometimes not.
Using a deck of laminated cards with the students’ names written on them, I ensure that every student has an equal opportunity to speak. My response to every contribution is ‘thank you’, and I very rarely paraphrase or ask clarifying questions in this context. To students who ‘pass’, I simply respond with ‘OK’.
Cards are separated into two categories and then data entered into a spreadsheet about who contributed an answer and who did not.
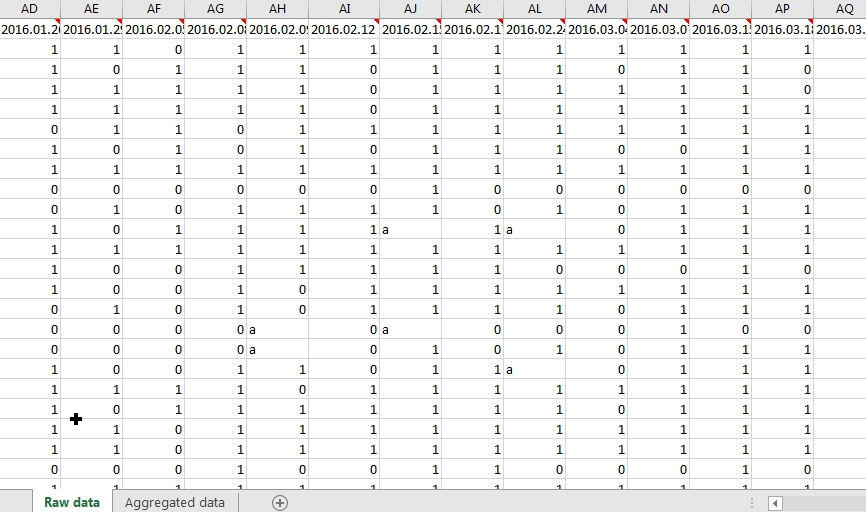
Visualizing data
The raw data is relatively easy to process to produce interesting graphs.
Referring to diagnostic assessment data in Reading from the beginning of the school year, I included only students who score ‘just below expectations’ or ‘below expectations’.

Next, filtered for students who scored ‘Just below expectations’ or ‘Below expectations’ on Aug diagnostic assessment in Writing.

Again, this graph doesn’t instantly reveal anything other than a general upward trend in participation.

Next, I wanted to explore a possible correlation between this exercise and improvement. The next graph is students with more than 10% improvement on ongoing informal and formal assessments in Reading from Q1 to Q3.

Next, students with more than 10% improvement on ongoing assessments in Writing from Q1 to Q3.
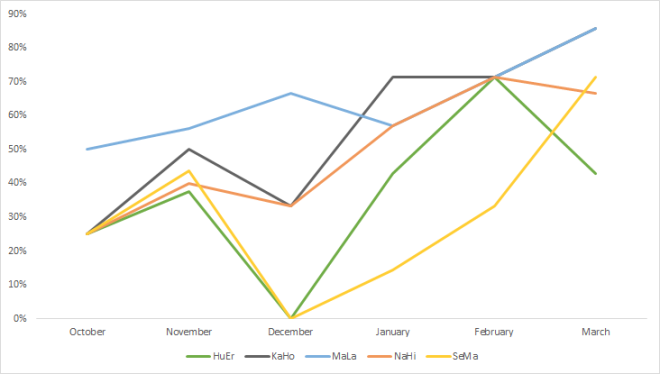
Interpreting data
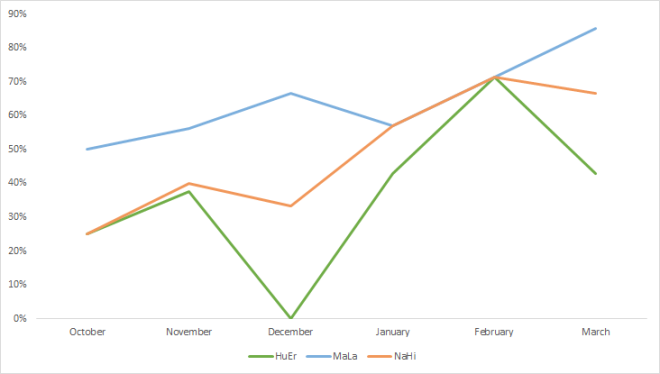
This is the first graph which indicates a clear correlation. With only two exceptions, students whose writing has improved are also increasing their participation.
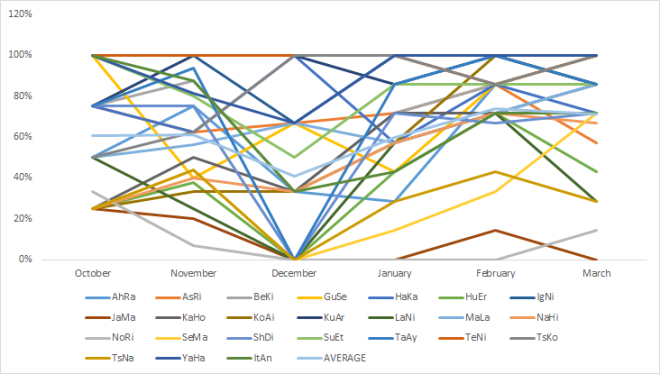
Since the objective is to improve language skills, I tried including only students who consistently achieve below 80% on ongoing assessment in English language.

Compare to consistently strong achievers in language.

Interesting that consistently higher performers seem to have random participation while consistently lower performers are participating progressively more and more.
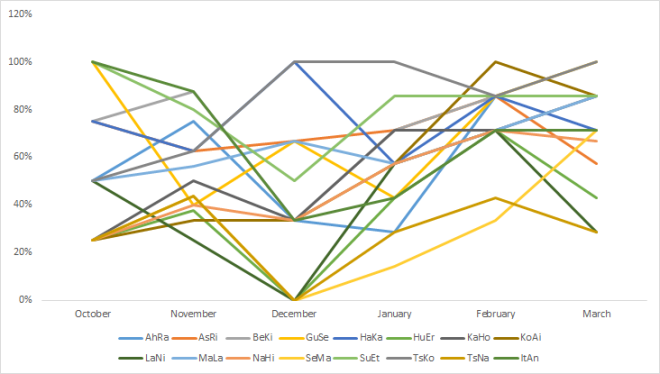
If only for the purpose of having more data visualization, members of most advanced guided reading group.
And the least advanced guided reading group.
It’s exciting to see that this activity is impacting the exact group of students it was designed to benefit.
When the class completes its end of year diagnostic assessment in Language, I expect to see similar improvements among students who have gained confidence as communicators through this simple activity.
Finally, here is the whole class average.

Unexpected outcome
Rather than analyzing individual students, this graph reveals something I hadn’t expected. If I compare the number of opportunities to speak with the average rate of participation, there is stark correlation.
Number of data points (% participation):
October 4 in one week (61%)
November 16 (61%)
December 3 (41%)
January 7 (60%)
February 7 (74%)
March 7 (71%)
It would seem that the more we do this activity, the more participation there is. Thinking of the student trying to build confidence, it makes perfect sense. If one hesitates, one loses an opportunity. However, missing a chance might be just the motivation one needs to seize the next one. If that next opportunity comes sooner than later, one is more likely to take it.
And so, the data comes full circle from thinking of individual students, back to individual students.
Peter Gow’s post, The Data Challenge for Schools – What Problem Are You Trying to Solve?, reminds me that the importance of data is not about averages, it’s about outliers. The greatest impact can often be made where there are cracks or gaps in the data. What is important is being intentional when gathering data so that when it is organized and interpreted, it answers the initial question.
It’s also important to remember that while ‘data’ and ‘gut’ are not the same, as Doug Johnson notes in his post, Data or gut?, through investment in time and training, it is possible to align the gut more precisely through data.
