The past
Data has been an undercurrent in my teaching since my first classroom in 2007. Of course, in that year, I struggled to gather data and there was virtually no chance of utilizing much of it to inform and enrich instructional planning. For good or ill, data is not essential to the survival of a first year teacher.
Each year after, I slowly improved, including a variety of experiments like the one shared in the post Student Empowerment | COETAIL final project. I tried different forms, organizers, notebooks, etc, until finally unveiling an integrated digital system last year. I shared it as a presenter at the GAFE Summit 2016 in Kobe, Japan, and used it for the school year to publish students’ ongoing assessment data, and other key information such as website usernames and passwords, directly to them as web pages. After celebrating and discussing the system, I felt that it was terribly unsatisfying.
The present
Inspiration came in the form of media such as Jack Norris’ keynote presentation from Strata + Hadoop World in San Francisco, Let’s Get Real: Acting on Data in Real Time, embedded below.
The concept of ‘data agility’ through converged data and processing appealed to me because what I sought a tool which would organize all assessment data in a way that could be searched, shared, and analyzed. Over the years I had been introduced to many ‘tracking systems’, only to discover that they were utterly unmanageable at scale. Ticking boxes on scope and sequence documents or highlighting learning objectives almost arbitrarily seemed like a show at best. In fact, a colleague who shared such a system with me admitted that at the end of a term, due to a lack of hard data, he would simply choose outcomes to highlight on every student’s document regardless of their actual progress or learning. To quote Mr Norris, I wanted my data to ‘get real’.
While designing my own system, I became somewhat of an amateur data scientist. The implications of the article Putting the science back in data science got me thinking about the flow from data entry to visualization and publishing. A quote from the post Can Small Data Improve K-12 Education? helped to clarify the objective for the project.
‘Small data observes the details or small clues that uncover large trends. The idea is that by honing in on the elements that make up relationships and narratives in schools, education can be enriched.’ The Edvocate

The future
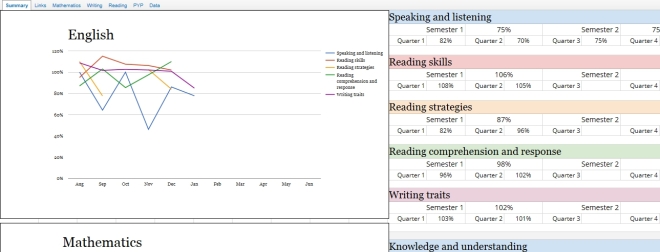
This system has been remarkably effective and unlike last year, I only plan to make minor tweaks, especially to the user interface. Feedback from students and parents revealed, as I expected, that there are too many graphs and that it’s difficult to know which are more or less important.
Another feature I plan to add is a Google Form which mirrors the data entry document which would allow teaching assistants, specialists, and even parents or students themselves to contribute data to the system.
If articles like The Three Ways Teachers Use Data—and What Technology Needs to Do Better by Karen Johnson and 7 Steps to Becoming a Data-Driven School by Eric Crites are any indication of the direction that data utilization is heading in education, I’m glad to be along for the ride.
